Global Outlook: First 9 Months Market Drivers
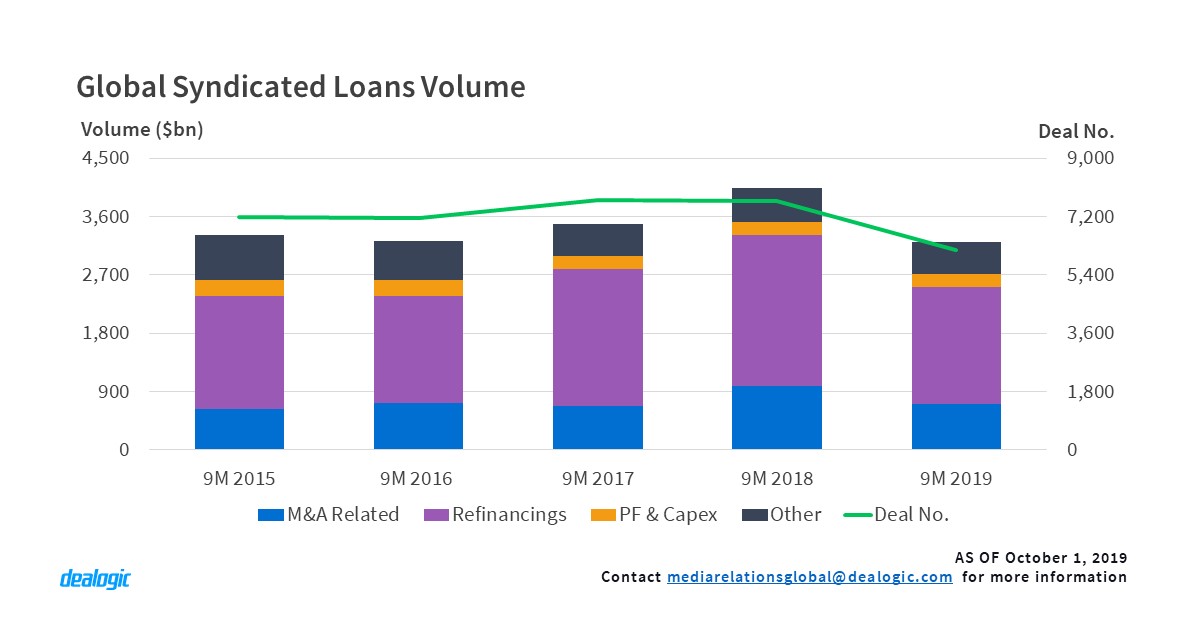
Sluggish economic growth driven by trade wars and political uncertainty has marred 2019. Both the syndicated loans market and the world economic output (WEO) echoed the same story. Whilst WEO fell to 3.2, its lowest since 2017 (3.5) according to the IMF, the first nine months (9M) of 2019 saw both volume and activity for the loans market dropping to $3.20tr via 6,153 deals for the first time since 2016 ($3.22tr via 7,156 deals).
The impeding uncertainty has not been conducive for neither new acquisition financing which witnessed a 27% fall in volume nor project finance and capex facilities with saw a reduction of 6% year on year. Furthermore, non-investment grade facilities saw their share shrinking from 44.5% to 38.8% compared to 9M 2018, highlighting less appetite for risky debt.
Opportunities in this slow-paced and risk-averse environment have been mainly through the debt wall. Refinancing and amendments have been dominant once again with 56.4% share of total activity. Furthermore, a key volume generator across use of proceeds has been jumbo* deals which accounted for 63.5% of the global loans. For instance, deals such as Fiserv $17.0bn and Broadcom $15.5bn heavily contributed to maintaining the Technology sector at the top for the 4th consecutive year despite shrinking volume and activity of 11% and 23% respectively, from the same period last year.
US LevFin: Investors enjoying higher margins
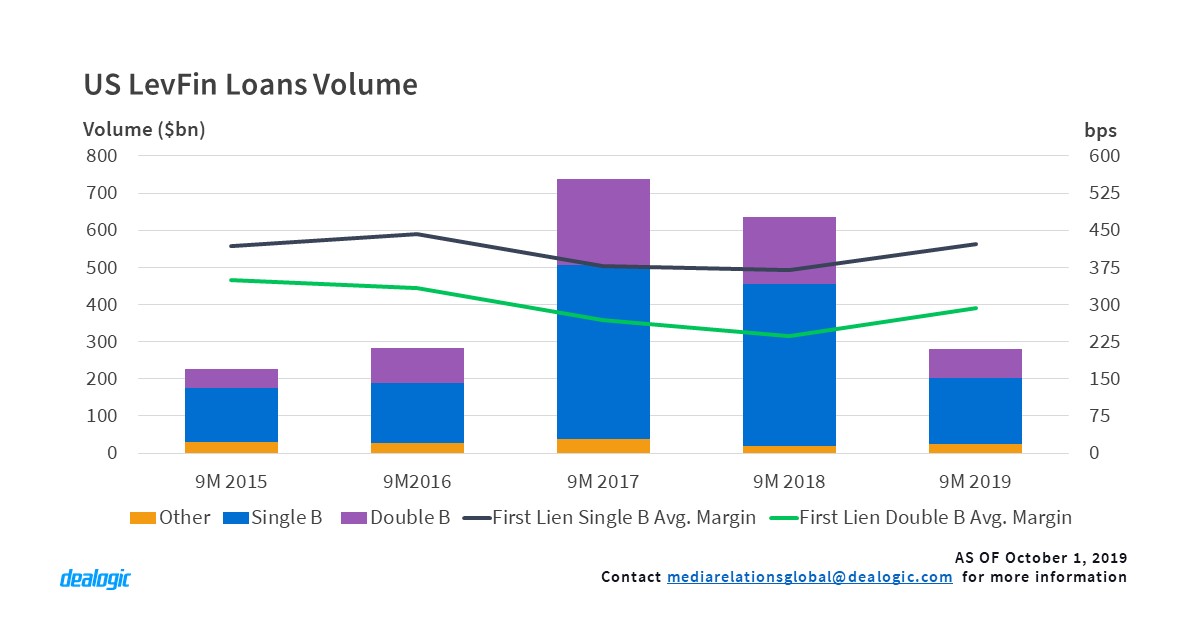
After feast years, US leveraged finance saw volume and revenue reaching $1.28tr and $8.7bn respectively in 2018. So far this year, investors took a more cautious approach leading to US Institutional leveraged loans falling to $280.8bn and 621 deals. Volume fell by 56% year on year, the lowest 9M since 2015.
Both single Bs and double Bs suffered almost a 60% plunge in volume year on year. The fall in volume came amidst the widening of margins. Single Bs and Double Bs first lien margins increased by 52bps and 57bps respectively from 9M 2018.
Another important dynamic in US LevFin so far this year is the increasing share of High Yield (HY) which was up by 8.2 points year on year. The growth in HY share coincides with corporates coming back to the HY market despite increasing spreads. 75.9% of HY issuance this year has been driven by corporates whilst sponsors still relied heavily on the loans market to tap financing.
Despite a deceleration in number of deals done which went from 1189 in 9M 2018 to 782 9M 2019, Financial Sponsors are still the main fee payer for the US levfin market. Financial Sponsors contributed 64.6% of total levfin revenue so far this year. With a good amount of dry powder at their disposal, they are likely to continue to be the main fee driver for that market. With LBOs such as Zayo Group $6.7bn in the pipeline and $1.09tr of sponsor related debt coming due by 2025, the loans market will undeniably keep a close eye on Financial Sponsors.
US Investment Grade: Jumbo deals are the kingmakers
US investment grade (IG) loans were in line with the general trend for volume and activity and saw a drop from $1.03tr via 695 deals in 9M 2018 to $976.1bn via 651 deals in 9M 2019. Yet, Healthcare, Technology, Finance and Oil & Gas had a strong 9M 2019 with volume year on year jumping 83%, 43%, 5% and 49% respectively. Jumbo deals which accounted for 92.5% of the top 4 sectors’ volume, have once again dictated sector rankings in the US IG space.
On the other hand, the sharp fall in Jumbo volume for Telecoms has pushed the sector out of the top 10 so far this year. After a strong 9M 2018 driven by Comcast’s $22bn and Deutsche Telekom’s $19bn deal, the sector saw a 70% dive in volume despite an increase in number of deals from 10 to 12.
Looking forward, US IG strong performance in previous years created an interesting pipeline for refinancing. By 2025, $512.9bn of US IG loans will be coming due with the Real Estate, Utility &Energy, Technology sectors holding 17.0%, 15.1% and 13.8% respectively of the debt wall.

EMEA: Looking beyond expected Brexit
Deal or no deal, Brexit has hugely affected the EMEA-marketed loans market which was down by 26% from 9M 2018. UK which was previously the main volume contributor in 9M 2018 with a share of 16.6% followed by Germany and France with 15.7% and 11.9% respectively is now lagging France (15.1%) and Germany (14.5%) with only 12.6% market share. This year marks the lowest UK volume since 9M 2012 ($91.9bn) where jumbo deals, accounting for 16% of activity, have once more driven volume creation.

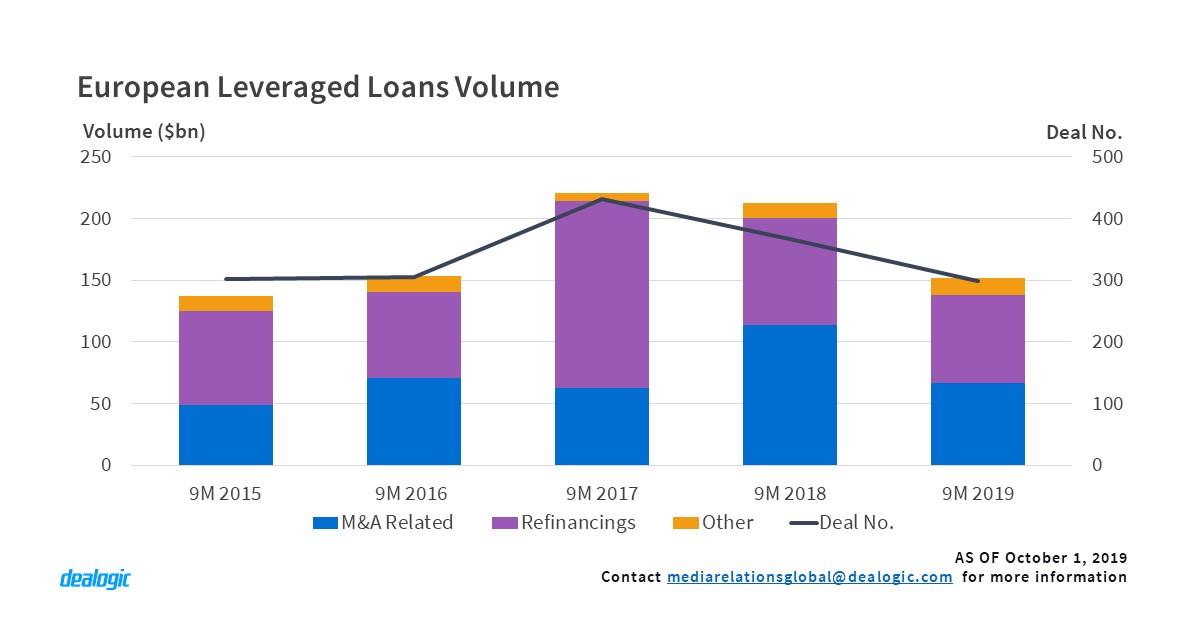
European leveraged loans which totalled $151.9bn in 9M 2019, saw a 29% drop in volume. The decline marks a reduction of Financial Sponsor share which fell from 67.5% in 9M 2018 to 54.3% in 9M 2019. New leveraged M&A related financing dropped by 41% with only 90 LBOs reaching signing date in 9M 2019 compared to 135 in the same period last year.
Looking beyond expected Brexit, $1.62tr of EMEA loans will be coming due by 2024 – out of which 63.7% are investment grade. Sectors which will offer higher refinancing opportunities are Transportation, Oil & Gas and Real Estate which account for 10.9%, 10.1% and 9.2% respectively. From a leveraged perspective, $334.2bn of Financial Sponsor lending is due to mature by 2025 with Technology sector holding the lion share.
APAC marketed M&A financing marginally on the rise
APAC (ex-Japan) marketed loans which reached $339.5bn via 926 deals is at its lowest volume since 2013, mainly due to political instability and the trade war. China, the region’s main volume driver, had its lowest 9M ($117.7bn) since 2015 ($108.2bn via 209 deals), the 3rd consecutive year loans volume fell. While M&A financing in China has taken a back seat with a 20.8% year on year fall, project finance and capital expenditure have been in growth mode, up 8% on both activity and volume.
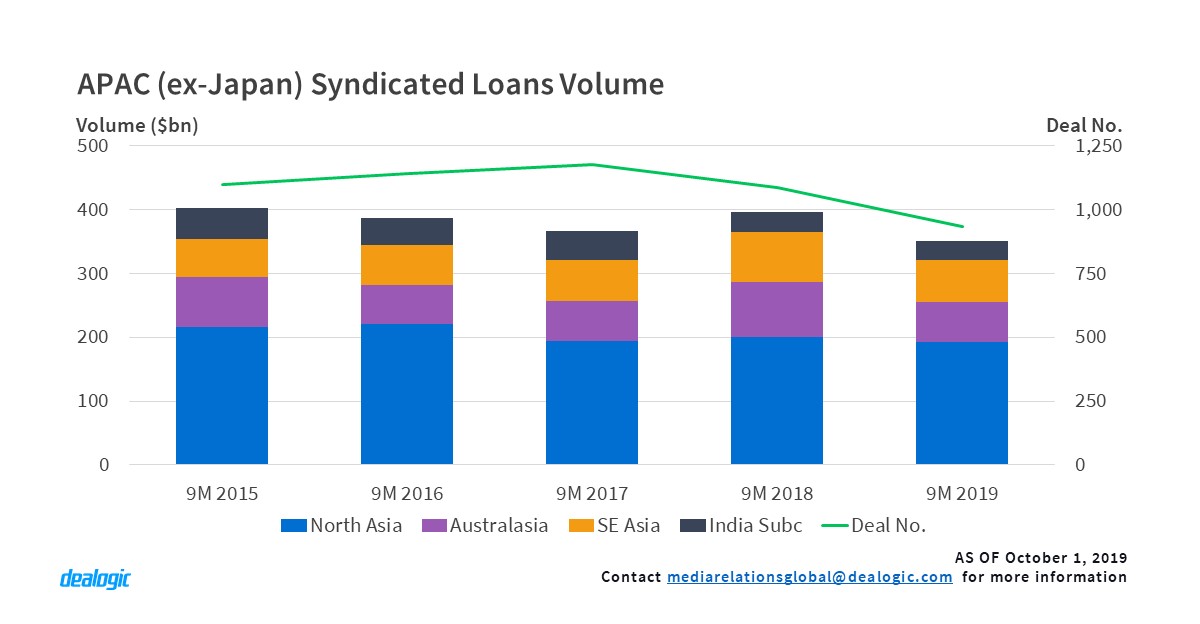
The bulk of facilities done in the region are concentrated around refinancing and amendments which accounted for 37.9% share of the market. M&A related financing marketed in APAC has increased year on year from $28.0bn to $31.4bn, with nearly 70% of the volume generated by North Asia and Australasia.
– Written by Dealogic Loans Research
Data source: Dealogic, as of October 1, 2019
Contact us for the underlying data, or learn more about the powerful Dealogic platform.