Debt volume in 2019 close to highest on record
As another year closes full of uncertainties and fears haunting the financial markets, the unsettled environment was met in stark contrast by the confident performance of bond sales in the primary market. In 2019, a total of $7.148tr worth of bonds were sold to investors globally via 22,188 deals. Even though activity last year was far from the busiest, the volume issued was the second highest of the decade (only behind 2017’s $7.154tr), bringing the average deal size to $322m -the highest of the decade.
The year started with EMEA DCM quarterly issuance ($753.4bn) outperforming Americas ($736.5bn) and APAC ($474.6bn). Every world region maintained a steady flow of bond pricing in the middle of the year, with Q2 and Q3 achieving similar figures for each region: $763.6bn and $765.8bn in Americas, $522.0bn and $506.0bn in EMEA and $523.6bn and $554.1bn in Asia Pacific respectively. In the last quarter however, all markets slowed down, especially during the traditionally weakest month of the year, December. That month reached $281.4bn of global issuance, a small contribution to the $672.9bn issued in Americas, $422.8bn in EMEA and $453.2bn in Asia Pacific in Q4.
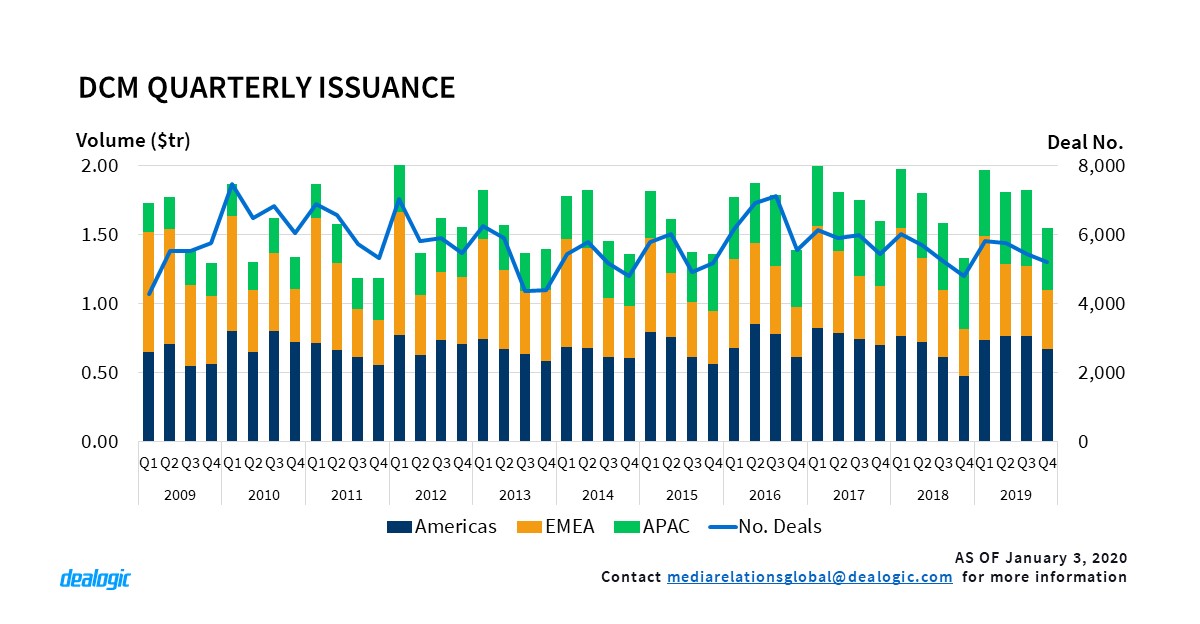
The remarkable performance of the market in 2019 was produced through different contributions from each continent. Asia Pacific reached at total of $2.01tr of volume issued, keeping-up the moderate (6% year-on-year) but consistent growth of the region’s debt markets over the past decade. APAC issuance in 2019 beat the previous year’s as the highest on record, also a reoccurring trend of the past four years. Americas debt markets remained strong, growing 14% annually to $2.94tr distributed amongst investors. In contrast, European debt markets remained stagnant ($2.06tr, -1% dip) and brought the EMEA region to a lackluster $2.20tr issued in 2019, almost the same volume as distributed in 2018. The region closed a very irregular decade with lower debt raised at its closing than at its beginning ($2.23tr issued in 2010).
Corporates lead as credit quality deteriorates
The growth bond markets achieved across different regions in 2019 was driven by the engine of credit origination: the corporate sector. Bond pricing by industrial firms grew in 2019 by 13% to $2.54tr of funds raised. Other borrower types also performed well: financial institutions sold $1.85tr and SSA entities $1.60tr (with 8% and 11% respective annual increments). In contrast, the securitization market shrunk by 9% to $1.16tr worth of receivables sold to bond investors.
The good performance enjoyed by corporate bond sales was predominantly sustained by the increase of high-yield debt, which went from $317.8bn issued in 2018 to $481.4bn in 2019. This remarkable 52% increase was split unequally between regions: Asia Pacific went up a booming 92% to $77.2bn, Americas grew by 55% to $277.5bn and EMEA raised $126.7bn, 29% more than in 2018. On the other hand, investment grade issuers were more conservative, and only in Americas did low-risk corporate debt make significant gains: from $638.0bn issued in 2018 to $765.2bn in 2019. Asia Pacific and EMEA corporations, with $786.1bn and $501.3bn issued respectively, maintained similar levels to 2018.
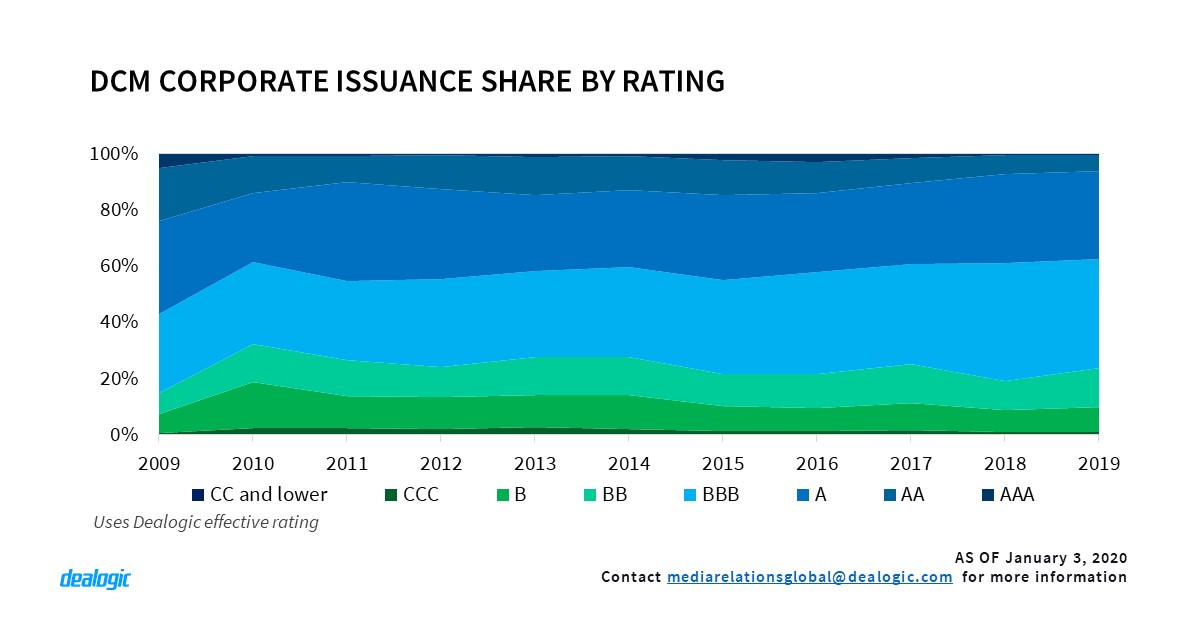
The above trend of the corporate bond market is confirmed when we look at quality of the debt. Issuance of BBB-rated tranches grew by 10% in 2019 to $760.0bn, followed by single A with $610.4bn. This latter rating category grew 18%, partly at the expense of AA-rated issuance which declined by 2% to $112.6bn. In contrast, BB-rated and B-rated paper rocketed by 65% and 37% respectively to $272.5bn and $176.9bn. Credit quality kept favoring middle rating categories, with a clear decline in low-risk debt.
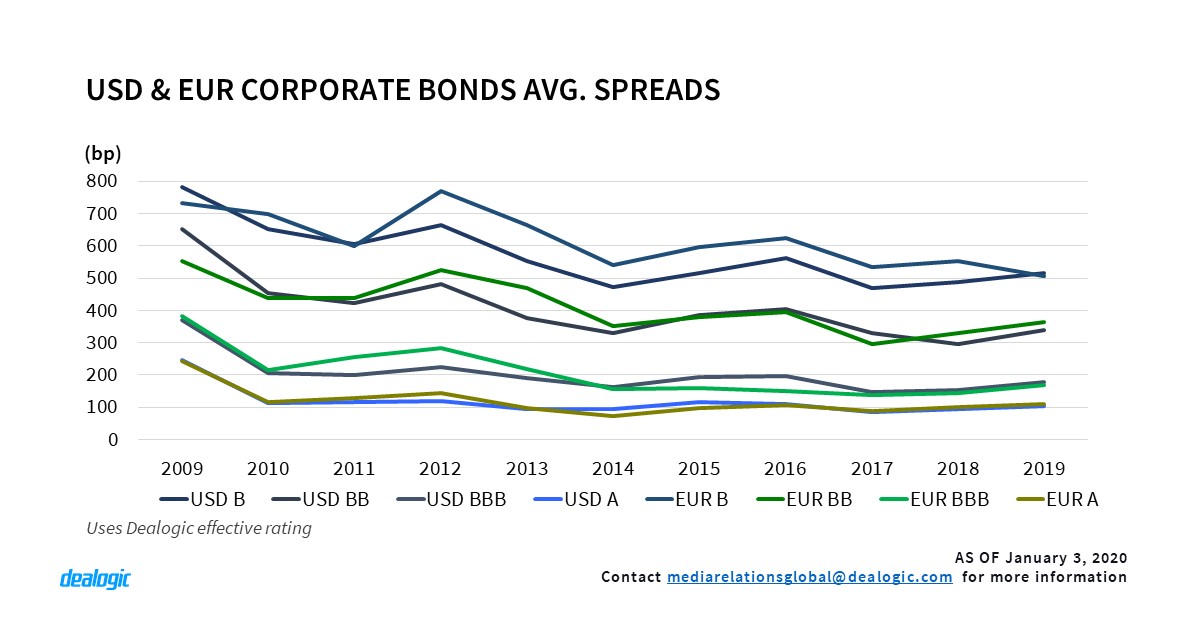
Such situation is the consequence of the low interest rates enjoyed by corporate borrowers in recent years. The amount of debt sold to investors with a yield of 1% or less went from $88.3bn in 2015 to $288.6bn in 2019. Other yield ranges show more irregular data, except for yields between 3% and 5% ($834.6bn issued in 2015 to $978.2bn in 2019). Average spreads went up in 2019, however, considering monetary easing in the US and ultra-low interest rates in Europe, it cannot be considered as an advantage to investors. In summary, spreads in almost all ratings categories for US dollar and euro-denominated debt went down during the decade.
Adding to this environment of decreasing returns, riskier issuers also sold notes with lighter covenants. Under these conditions, the growing space of high-yield bonds were a strong competitor to the leveraged loan market, where volumes declined in the US and remained flat in Europe. Nonetheless, market experts have endlessly warned against the build-up of this situation, as a potential market crash would bring down an ever-larger share of the market.
DCM revenue grows further than volume
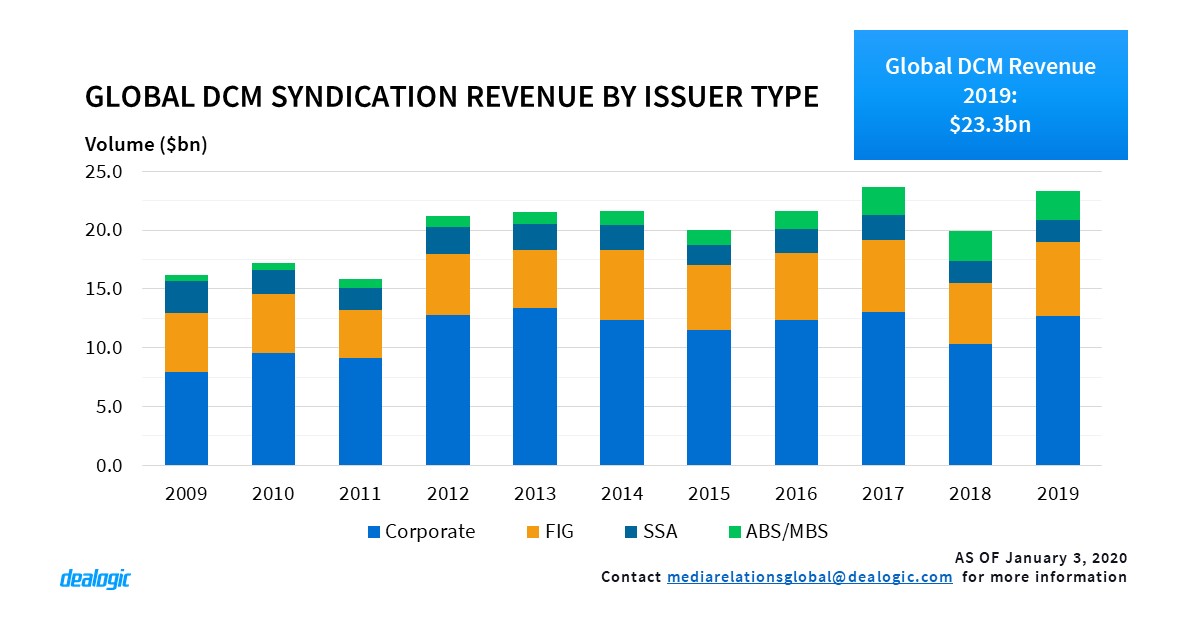
If 2019 was a good year for debt issuance, the revenue paid to manage and execute primary bonds sold to investors faired even better. A total of $23.3bn was cashed by securities firms, 17% more than in 2018 and the second-highest bond wallet on record. This increase was significantly higher than the growth of issuance volumes, illustrating banks rising abilities to improve profit generation from bond sales. For every $1m in fees paid by issuers in 2019, $307m of debt was allocated to investors. This figure was higher in 2018 ($336m).
American clients, driven by corporate firms, paid $11.6bn, or half of the total wallet, to bond syndicates, while EMEA and Asian issuers took equal shares of the remaining half ($5.843bn and $5.841bn respectively). Corporates continued to generate the largest share of the wallet, at 55%. In 2019, underwriters cashed a total of $12.7bn from corporate bonds, 24% more than the previous year, while financial institutions were also profitable clients, paying $6.3bn to the banks running their deals, up 20% from 2018 figures. On the other hand, SSA entities generated similar revenues in 2019 ($1.870bn) and 2018 ($1.871bn), while total securitization fees dropped year-on-year by 3% to $2.5bn.
Lowering rates bring volumes up in Americas
In America, due to political and economic uncertainty over the trade and technology wars, the US economy started to slow down. In this environment, monetary policy driven by the US Federal Reserve became much looser, as the Fed’s Open Market Committee reduced its federal funds rate three times, totaling 75bps, in 2019. The Fed was not alone, as Brazilian and Mexican central banks also cut their benchmark rates three times, creating a low-rate environment across the continent. Borrowers took advantage and tapped the bond markets throughout the region.
Volumes sold by US issuers in 2019 reached $2.50tr, 17% higher than 2018’s issuance. Despite the good performance however, US-marketed bond sales were more subdued. The $3.09tr sold to US investors in 2019 was 7% higher than the volume issued in 2018, but far from the $3.35tr issued in 2017. The US dollar had plenty of appeal last year across continents; however, global USD-denominated issuance by non-US borrowers only rose by 3% in 2019 to $1.17tr. Comparable euro-denominated issuance priced by non-European entities grew 10% in the same period ($470.9bn sold last year). If interest rates in the US eased up and became more attractive in 2019, the lower European rates won the game.
The southern half of the region achieved consistently positive performances in the bond market, especially when paper was sold to cross-border investors. LatAm international issuance rose from $83.9bn issued in 2018 to $112.0bn in 2019. Brazilian and Mexican borrowers were the main contributors to this performance, as Brazilian international issuance went up by 70% to $28.6bn in 2019, and Mexican volume grew by 45% to $33.7bn. Pro-growth policies implemented by the Brazilian administration, as well as a potential North-American trade agreement, were met with investor optimism. In contrast, Canadian cross-border bonds took a 6% dip in 2019, totaling $151.6bn. Canadian rates remained stagnant, however domestic issuance was able to grow year-on-year by 12% to $142.0bn issued in 2019.
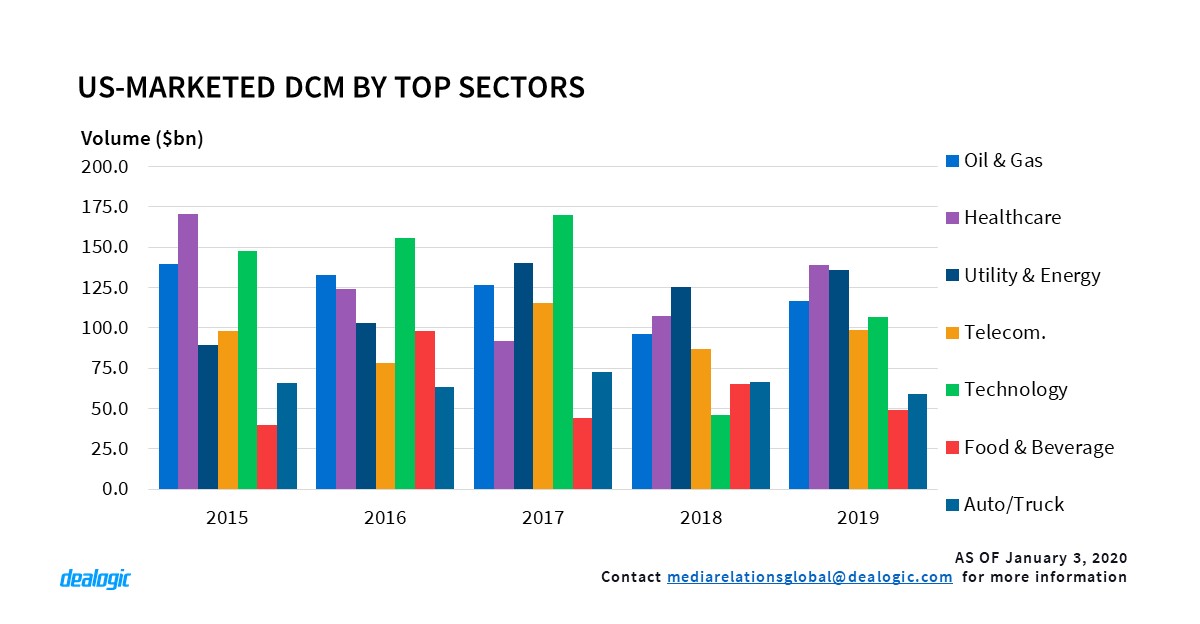
Corporates and SSA use funding opportunities in the US
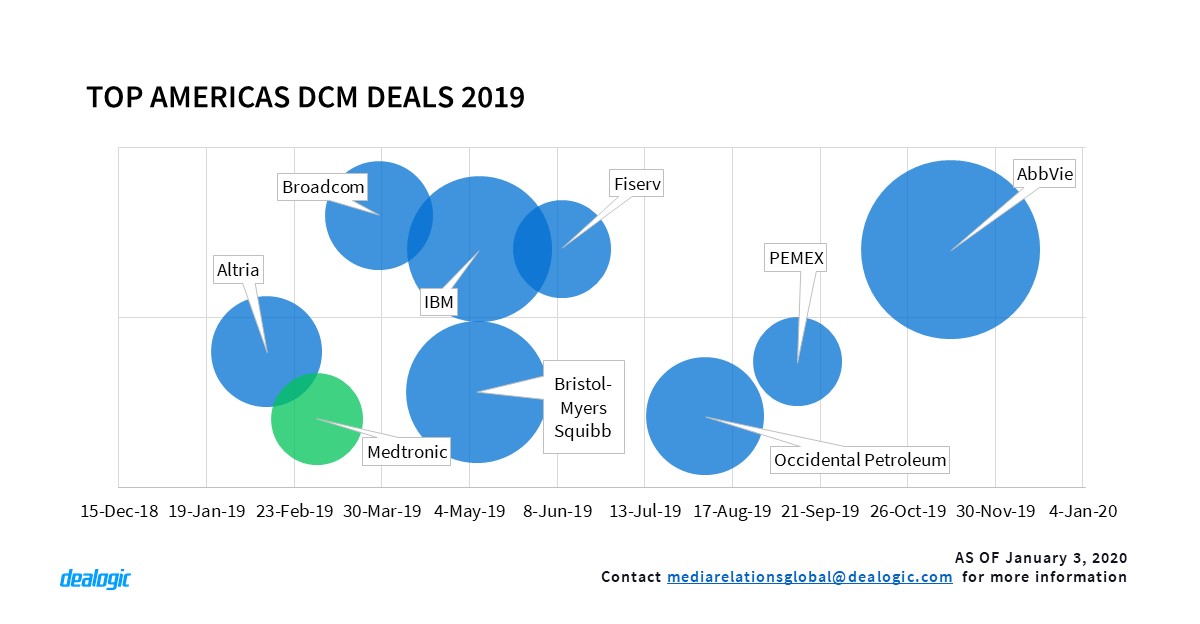
With the successive cuts of interest rates in the US those firms selling bonds to local investors did not hesitate and took advantage of the situation. In 2019, corporations increased their bond sales by 14% to $1.05tr, the second highest volume on record. The top eight issuances alone contributed more than $100bn to this figure. The industries with significant debt funding growths were, healthcare (29% to $139.2bn), utility & energy (9% to 135.8bn), oil & gas (21% to 116.7bn), technology (133% to $106.9bn) and telecommunications (14% to $98.9bn). However, other industries faired less agreeably, such us retail issuers; their bond sales declined by 74% to $16.7bn in 2019.
Deals done by industrial firms were the most lucrative for bond underwriters, generating $7.2bn of DCM revenue in 2019, 25% more than in 2018. Sovereign, supranational and agency bonds also increased their volume and the fees paid to syndicates: $671.0bn of debt issued in 2019 generated $3.0bn of wallet revenues. Meanwhile, the finance industry’s regular issuance remained stagnant at $556.5bn (1% up), while their asset-back and mortgage-backed notes issuance declined 8% to $814.5bn. The sharp decline of US leveraged loans it’s taking its toll on the CLO market space and repackaging of these instruments slumped from $268.5bn in 2018 to $162.8bn in 2019.
Asia Pacific keeps strong issuance pace
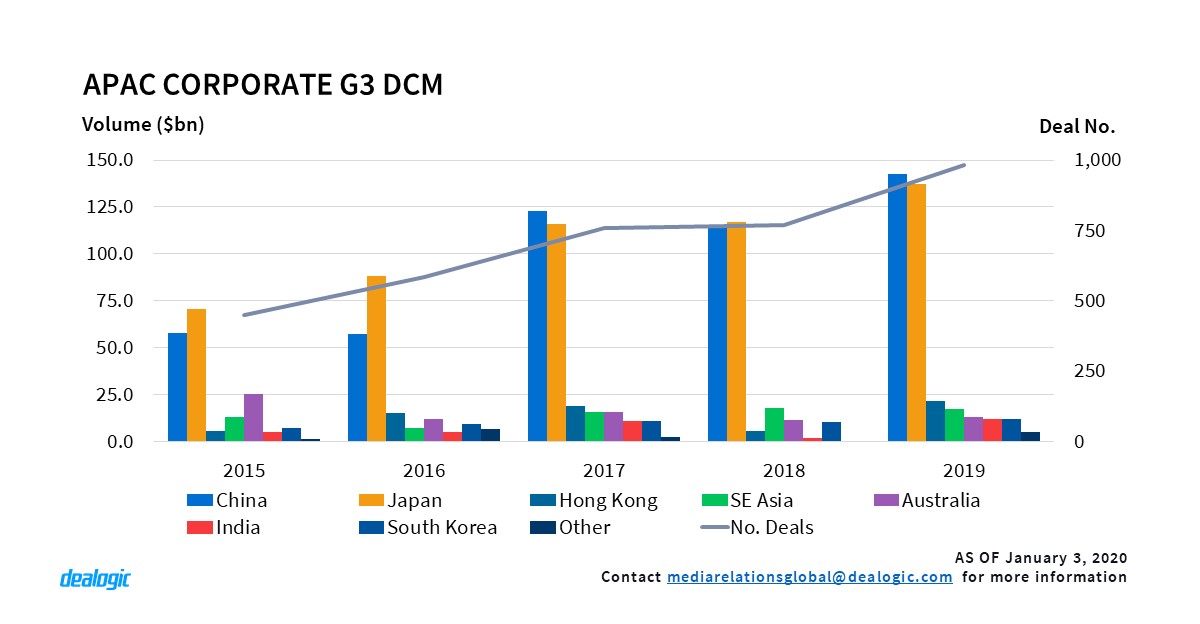
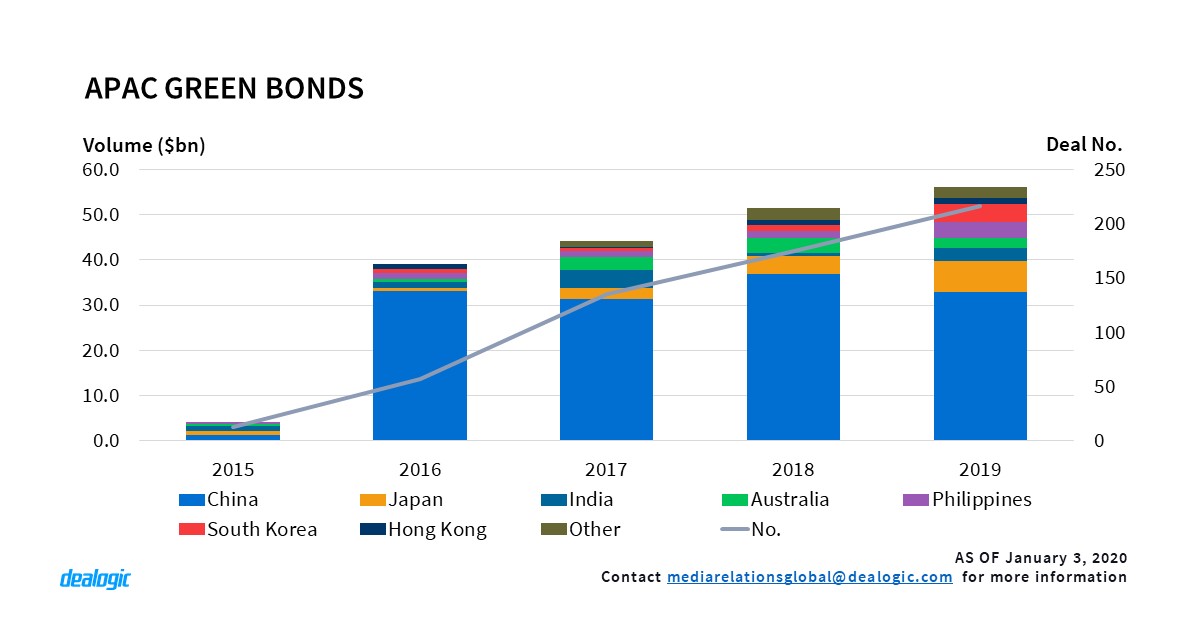
Asia Pacific debt markets have remained active throughout 2019, in spite of rising default cases in the region. Issuers have raised $768.7bn in the G3 market (US dollar, Euro & Japanese Yen), up 16% from last year. This marked the second highest volume on record, after the $782.0bn raised in 2017. However, the 2,098 deals priced in 2019 is the highest number on record, up 9% from last year when 1,926 deals completed. One reason for this uptick is the popularity of reopenings for companies who want to raise debt more frequently and with less preparation work. This year, 182 deals priced in the Asian DCM market were reopenings of an existing transaction, compared with 164 fungible tranches priced last year. Corporate issuance accounted for 139 of these deals, up from 105 priced last year. Green bonds also contributed to this growth, with 86 deals priced this year compared with 61 deals in 2018.
Corporate credit grows across the region
The corporate sector continues to dominate APAC G3 issuance, with a 47% share totaling $360.6bn raised via 981 deals, an increase of 29% from last year’s $279.5bn. Japanese corporate issuance has continued to expand since 2015, this year reaching a record high of $137.0bn worth of notes sold, up 17% from $116.8bn in 2018. The Japanese market has been fueled by eighty $500m+ transactions which raised $85.2bn, accounting for 62% of the market’s volume.
Similarly, Hong Kong corporate bonds marked their highest volume since 2012 with $21.5bn raised via 41 transactions. Despite the on-going political protests in the city, bond markets seem to be unaffected. Hong Kong corporates raised $14.5bn in the second half of 2019; the highest volume for any second half on record.
2019 has also seen Indian corporate issuance explode to $12.2bn raised via 28 deals, six times the $2.0bn raised in 2018. The largest contributors to this jump were the green bonds issued by utility & energy firms, consisting of $3.0bn from 8 deals -24% of the total issuance.
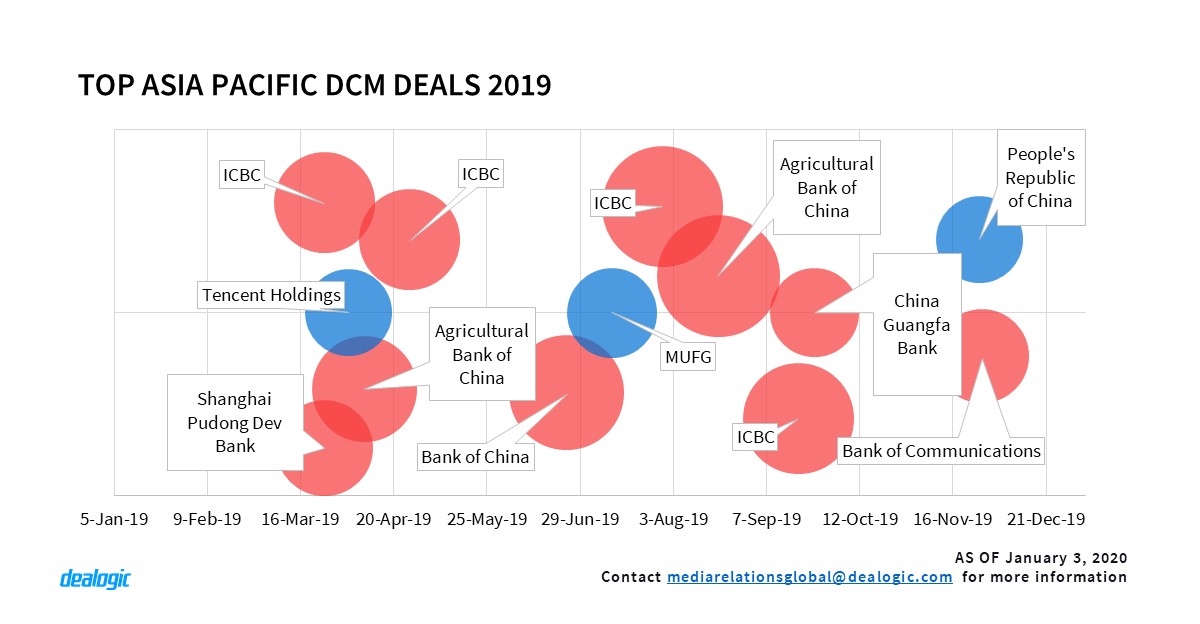
Real estate borrowers keep driving Chinese bond market
This year, China once again created another record for G3 bond volume by pricing 550 deals and raising $224.7bn, up 29% from 2018. Both corporate and SSA sectors reached their highest yearly volume on record, with $142.7bn and $20.2bn respectively. Real estate issuers have widened their dominance in the corporate sector with a 53% share, up from 42% in 2018. Provincial and city-level state-owned enterprises also contributed $30.7bn via 105 deals. Out of these 105 deals priced, 32 of them were first-time issuers in the G3 market, while 6 of them were from Jiangsu province. In the SSA sector, the Chinese government broke their 15-year hiatus from the euro market. In Q4, they issued a €4.0bn bond issuance, and for the first time ever set its maturity at 20 years. They also issued another $6.0bn 4-part issue in November, which marked the largest ever USD-denominated bond issuance from the Chinese government.
Euro grows instead of EMEA
Debt markets in EMEA remained still in an environment of political and macro-economic tensions in 2019. Elections in the European Union in the spring, the Brexit-saga, the German economic slowdown and the US-China trade war, created a challenging environment for debt sales across the continent. However, low rates were a safeguard for bond issuers to price deals, and investors still found favorable conditions in which to buy paper.
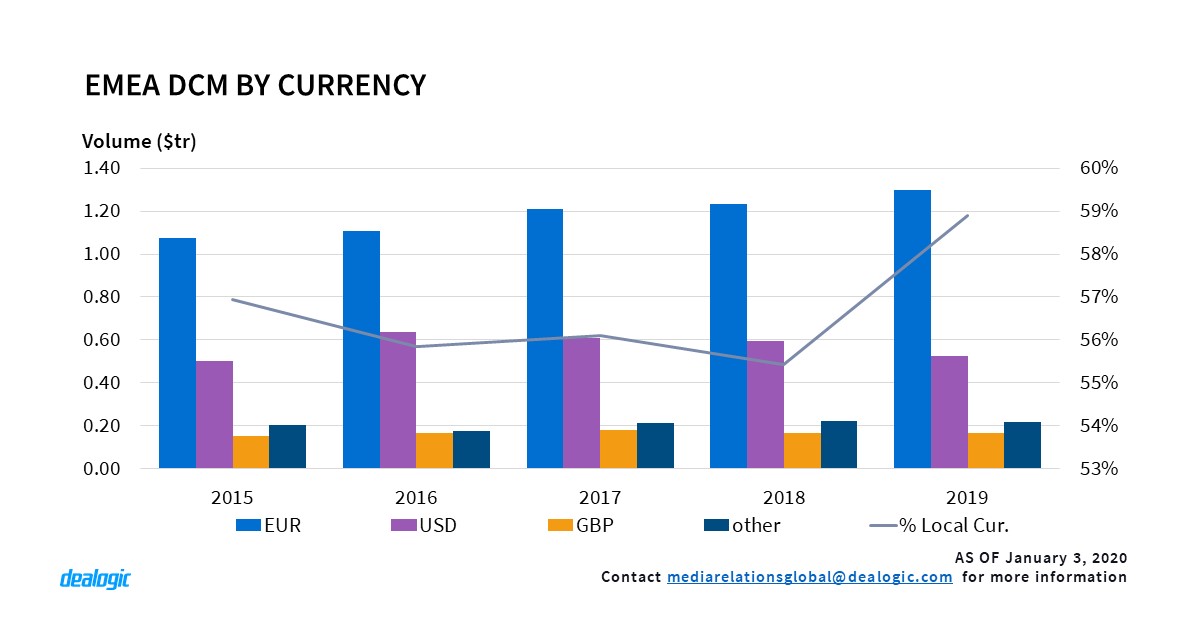
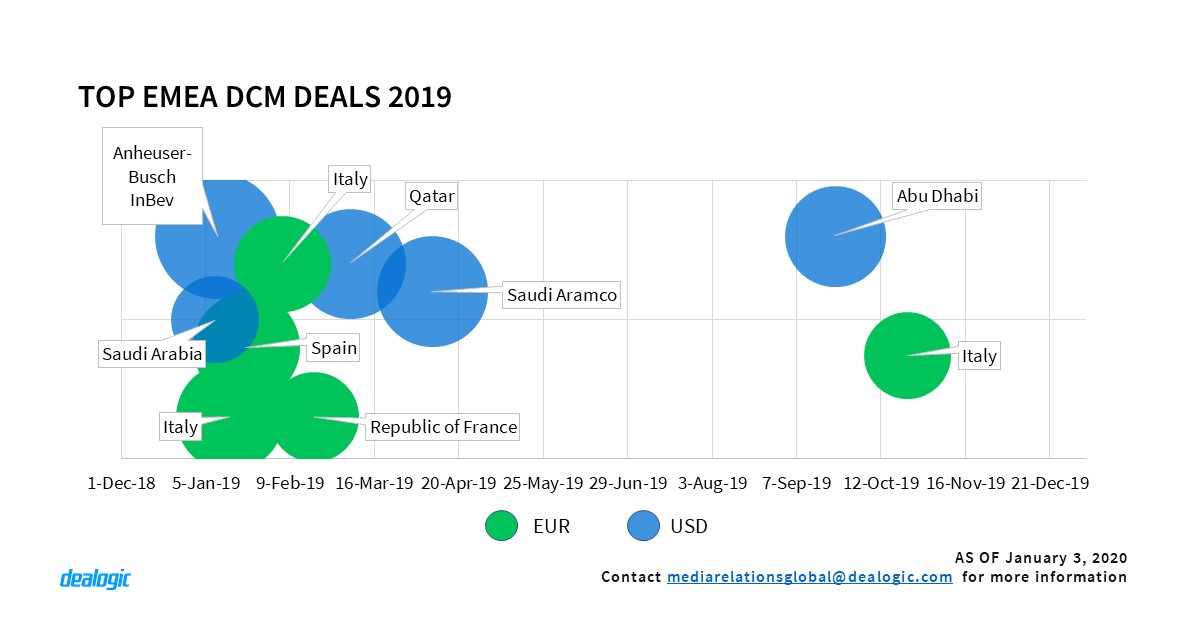
EMEA DCM volume totaled $2.20tr in 2019, down 1% from $2.22tr in 2018 and the lowest annual volume since 2016 ($2.09tr). Euro-denominated bond sales gathered momentum in the currency-basket, totaling $1.54tr; the highest volume in the past five years ($1.57tr in 2014). US-dollar deals from EMEA issuers dropped 11% to $525.6bn in 2019 from $593.6bn in 2018; the lowest volume since 2015 ($501.0bn). Meanwhile, US borrowers priced the highest volume of euro-denominated notes on record. They sold a total of $151.2bn to European investors; this is more than twice the volume issued in 2018 ($72.4bn). The favorable environment of low rates keeps driving North American firms to Europe to raise funds. More than 20% ($32.3bn) of the funding was earmarked to refinance outstanding debt.
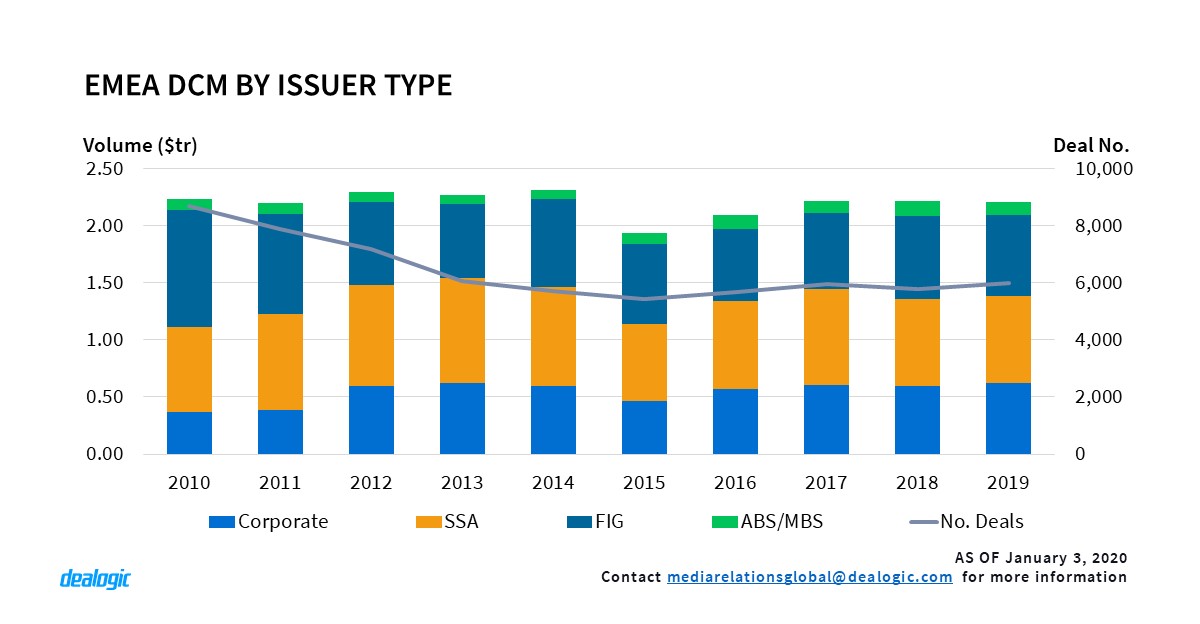
Corporates keep steady amidst general decline
Same as the other regions, the corporate DCM market in EMEA performed well and achieved the highest issuance of the decade. A total of $624.4bn of debt was sold by European firms in 2019, up 5% from $594.6bn in 2018 and the highest annual volume since 2009 ($648.2bn). Adding to the contribution by European high-yield issuers ($126.7bn in 2019, a 29% year-on-year growth), the increase was driven by transportation companies (58% year-on-year increase to $41.5bn), oil & gas issuers (29% increase to $54.5bn) and telecommunication issuers (18% increase to $68.3bn). The other sectors of the bond market were more subdued, with all issuances retreating from last year: SSA borrowers issued $163.1bn (1% down), FIG firms priced a total of $706.4bn (3% down) and the securitisation market dropped 16% to $110.6bn.
In September, the European Central Bank announced a fresh stimulus package, including an interest rate cut and a €20bn per month asset purchase programme which will continue into the new year. Meanwhile, the European Union has approved the Taxonomy of Sustainable Economic Activities, which will provide clarity and facilitate the road for further growth of the sustainable finance market. These future actions by EU policy makers, alongside the newly-elected UK government’s promise of Brexit by the end of January, might bring more certainty and create better conditions for bond markets.
– Written by Dealogic DCM Research
Data source: Dealogic, as of January 3, 2020