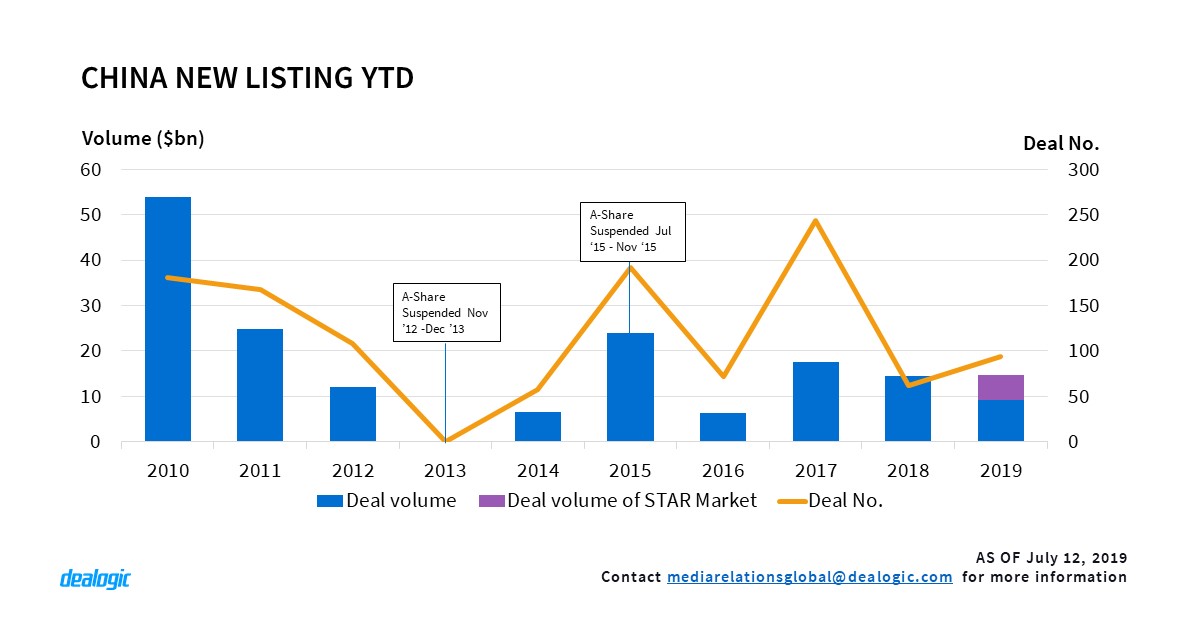
In just the first two weeks of July 2019, 28 companies have raised $5.5bn via new listings in China, already surpassing the full June numbers with 2x the activity and 1.6x the volume. Approximately 95% of the listing volume in these 2 weeks has been from companies that applied to list on the new Science and Technology Innovation Board in Shanghai, also known as the STAR Market.
The main goal of the STAR Market is to attract three types of companies that are not normally qualified to list on the other mainland boards: 1) companies with a weighted voting rights structure; 2) Pre-profit companies; and 3) Red chip companies listing onshore. The board launched on June 13th and the listing progress has so far been stellar. During the second week of July, 21 companies priced offerings, forming the most active weekly activity for Chinese New Listings since the third week of June 2015.
For these 25 companies, the listing application process took an average of 95 days from filing to pricing. This is far faster than applications for other Chinese boards this YTD – 723 days for Shanghai main board, 649 days for Shenzhen main and SME board and 685 days for Shenzhen ChiNext board. As of July 12th, 120 companies are in the listing pipeline waiting for the countdown to launch on the STAR Market.
High Price-to-Earning (P/E) ratio
The China Securities Regulatory Commission (CSRC) issued guidance in 2014, encouraging companies to price their listings with reference to the 1-month average static P/E ratio of their industry. Companies could risk having their applications delayed by weeks if their offer price deviated from the industry average. At that time, the average P/E ratio of listed companies across different industries was around 20, and the general consensus was to set the IPO price no higher than 23 times P/E ratio. In fact, the average P/E ratio of 1,187 listings from different industries since 2014 stands at 22.5.
This pricing approach does not apply to the STAR Market, as their pricing level does not need to follow CSRC guidance. The 25 companies that priced their listings so far have priced at an average of 53.4 times P/E ratio, or 2.4x more than those on the other boards. According to the offer documents, 88% of them have a higher P/E ratio compared to their own industry average. Advanced Micro-Fabrication Equipment Inc China has the highest P/E ratio of 170.8. The impact on the aftermarket performance of the new pricing methodology is to be seen after unveiling its curtain on July 22nd.
– Written by Vincent Li, ECM Research
Data source: Dealogic, as of July 12, 2019
Contact us for the underlying data, or learn more about the powerful Dealogic platform.